Gun Rights: Part 1: Total Deaths: Will Reasonable Gun Control Save Lives?

America STILL Has a Gun Problem
(This is now 9 years since I began this series of articles about guns and death in America. One would have hoped things would have gotten better as more and more kids and adults are dropping like flies do to gun violence. It hasn't.
I will update these articles where necessary with new information and new data - even though the NRA and their supporters tried to suppress data gathering - that has developed over the intervening years.)
America accounts for about 5% of the worlds population yet we also account for 42% of all gun ownership. The problem isn't the 2nd Amendment (which was written with the British in mind) and its guarantee that we can bear arms. The problem is we do not have a good handle (we barely have a handle at all in many states) on who owns the guns that are purchased. Common sense says that certain people, because of their character or past bad behavior, should be barred from possessing any firearm. And why is that relevant? Because firearms of any type are deadly and we as a government and society have a duty to protect one another.
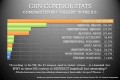
In 2013, I compiled the following summary of school shootings in America. As I write this on May 29, 2022, President Biden and his wife are visiting Uvalde, TX to give their condolences to the friends and families of nineteen 4th graders and two of their teachers who were mowed down by an 18-year old with an AR-15 semi-automatic rifle, a weapon of war that he was able to buy the week before just after his birthday. This massacre, the second worst in American history, took place on Tuesday, May 24, 2022, nine years and five months after the worst school killing in America on Dec 14, 2012.
Consider this very sad set of statistics as well as you work your way through the material presented in this series of articles on Guns in America.
- From 1840 - 1949 there were at least 86 incidents of school shootings in America. (0.79/year)
- From 1950 - 1959 there were 16 incidents (1.6/year)
- From 1960 - 1969 there were 17 incidents (1.7/year)
- From 1970 - 1979 there were 32 incidents (3.2/year)
- From 1980 - 1989 there were 42 incidents (4.2/year)
- From 1990 - 1999 there were 65 incidents (gun control enacted in this decade) - 6.5/year
- From 2000 - 2009 there were 68 incidents (assault weapon ban and other laws repealed) - 6.8/year
- From 2010 - 2019 there have been, so far, 230 separate school shootings!!!!! (23.0/year)
- From 2020 - there have been 73 school shootings so far!!!!!! (30.4/year)1
And they say America does not have a gun problem.
1 It is interesting to note that from 1990 through 1995 (assault wpn ban) net production ran from about 100,000 units to 400,000 units. From 1995 - 2005 (the year the assault weapons ban was not renewed), net production of assault production ran from 100,000 and rising to 400,000 units as well. After 2005, with the ban now gone, production ramped from 500,000 to 2.4 million in 2015 before falling back to 1.6 million on 2017. Compare that to the rise in school violence, many of them as a result of assault weapons.
https://www.washingtonpost.com/politics/2022/05/26/tallying-americas-fascination-with-ar-15-style-rifles/
A Short Legal and Legislative History
Federal Gun Legislative History
- 1791 – Bill of Rights ratified; it included the Second Amendment which forbade, initially at the federal level, abridgment of a citizen’s right to keep and bear arms.
- 1837 – The National Rifle Association formed.
- 1934 – Violent crime finally generates the first national response in The National Firearms Act. Public revulsion to the gangster culture during Prohibition raised to a fever pitch leading to laws implementing a tax on the making and transfer of automatic-fire guns, shotguns and rifles.
- 1939 – The Supreme Court makes its first major decision regarding gun control by upholding a federal ban on sawed-off shotguns. In the process, they implied the purpose of the Second Amendment was to ensure the federal government could not disarm state militias.
- 1968 – Lee Harvey Oswald’s purchase of the rifle used to assassinate President Kennedy was one reason Congress passed The Gun Control Act.
- 1972 – Congress created the Bureau of Tobacco, Alcohol, and Firearms was created
- 1976 – The D.C. City Council bars residents from owning handguns.
- 1986 – Congress passed The Firearms Owner’s Protection Act. The law prohibits felons from owning or possessing guns or ammunition.
- 1986 - The Law Enforcement Officer’s Protection Act was passed as well and It prohibits the manufacturing, importing and selling of ammunition that can penetrate a bulletproof vest.
- 1990 – The Crime Control Act directed the attorney general to develop a strategy for establishing "drug-free school zones." It included criminal penalties for possessing or discharging a firearm in a school zone as well as outlawing the assembly of illegal semiautomatic rifles or shotguns from legally imported parts.
- 1993 – The assignation attempt on President Reagan set of a national debate on gun violence and resulted in The Brady Handgun Violence Act. This Act established the National Instant Criminal Background Check System gun dealers are to use before selling a gun. The law was named after former White House Press Secretary James Brady, who was shot in the head during the 1981 assassination attempt. Coincidentally or not, this is when the decades long downturn in violent crime began.
- 1994 – Following this Act, Congress passed The Violent Crime Control and Law Enforcement Act that banned the manufacture, use, possession and import of 19 types of assault weapons, including AK-47s and Uzis. Congress let the law expire in 2004.
- 2007 - The U.S. Court of Appeals for the District of Columbia rules in favor of Dick Anthony Heller who sued the district after it rejects his application to keep a handgun at his home in Capitol Hill.
- 2008 – After the District appealed to the Supreme Court, it lost. The Supreme Court upheld the lower court ruling, striking down D.C. handgun ban as unconstitutional.
Legal History
United States Supreme Court
Constitutional Interpretations
- 1875 - United States v. Cruikshank, 92 U.S. 542 is a post Civil War era case where the Ku Klux Klan deprived freed slaves the right to bear arms, among other basic rights. The court ruled the application of the First and Second Amendments "was not intended to limit the powers of the State governments in respect to their own citizens" and "has no other effect than to restrict the powers of the national government," respectively. These in spite of the 14th Amendment’s intent to make the Bill of Rights apply at the state level. In summary, it ruled the federal government could not file charges against citizens in federal court regarding violations of other citizens' constitutional rights. It was up to the states to protect the fundamental rights of its citizens when other citizens abridged their rights. (JUSTIA) This was one of the many Supreme Court decisions during this period that neutered the 14th and 15th Amendments.
- 1886 - Presser v. Illinois, 116 U.S. 252 us the second post-Civil War era case related to the meaning of the Second Amendment rights relating to militias and individuals. The court ruled the Second Amendment right was a right of individuals, not militias. And, the Second Amendment does not extend to individuals having the right to form or belong to a militia. Instead it related to an individual right to bear arms for the good of the United States, who could serve as members of a militia upon being called up by the Government in time of collective need. In essence, while the Court declared that although individuals do have the right to keep and bear arms, a state law prohibiting common citizens from forming personal military organizations, and drilling or parading, is still constitutional because prohibiting such personal military formations and parades does not limit a personal right to keep and bear arms:
"We think it clear that there are no sections under consideration, which only forbid bodies of men to associate together as military organizations, or to drill or parade with arms in cities and towns unless authorized by law, do not infringe the right of the people to keep and bear arms."
The Court also noted that the Second Amendment does not fall under the authority of the 14th Amendment but only restrains the federal government from regulating gun ownership, not the individual states by saying:
"The second amendment declares that it shall not be infringed, but this, as has been seen, means no more than that it shall not be infringed by congress. This is one of the amendments that has no other effect than to restrict the powers of the national government, leaving the people to look for their protection against any violation by their fellow-citizens of the rights it recognizes to what is called in City of New York v. Miln, 11 Pet. [116 U.S. 252, 102] 139, the 'powers which relate to merely municipal legislation, or what was perhaps more properly called internal police,' 'not surrendered or restrained' by the constitution of the United States." (JUSTIA)
- 1939 – In United States v. Miller, 307 U.S. 174 the Court stated in part:
- "In the absence of any evidence tending to show that possession or use of a "shotgun having a barrel of less than eighteen inches in length" at this time has some reasonable relationship to the preservation or efficiency of a well regulated militia, we cannot say that the Second Amendment guarantees the right to keep and bear such an instrument. Certainly, it is not within judicial notice that this weapon is any part of the ordinary military equipment, or that its use could contribute to the common defense. Aymette v. State, 2 Humphreys (Tenn.) 154, 158. The signification attributed to the term Militia appears from the debates in the Convention, the history and legislation of Colonies and States, and the writings of approved commentators. These show plainly enough that the Militia comprised all males physically capable of acting in concert for the common defense. 'A body of citizens enrolled for military discipline.' And further, that ordinarily when called for service these men were expected to appear bearing arms supplied by themselves and of the kind in common use at the time."' (JUSTIA)
- 2008 – The seminal case so far on the right to keep and bear arms is District of Columbia v. Heller, 554 U.S. 570. Here the Court ruled the Second Amendment to reference an individual right, holding:
"The Second Amendment guarantees an individual right to possess a firearm unconnected with service in a militia, and to use that arm for traditionally lawful purposes, such as self-defense within the home. (Find Law, 2008)
The main question this ruling clarifies is that the arms, which the Second Amendment allows a citizen to keep and bear, which can be used for “traditional lawful purposes, such as self-defense within the home”; something the D.C. law prevented from happening. I will discuss the ramifications of this later in the book. A major issue Justice Scalia reaffirmed was that the Second Amendment does not protect all firearms, as many gun rights advocates claim to be true. Specifically Scalia wrote:
“We therefore read Miller to say only that the Second Amendment does not protect those weapons not typically possessed by law-abiding citizens for lawful purposes, such as short-barreled shotguns.” (Scalia, 2008, p. 53)
- 2010 - McDonald v. Chicago, 561 U.S. 742 (2010) - The Court ruled that the Second Amendment was incorporated against state and local governments, through the Due Process Clause of the Fourteenth Amendment.
In the decision, the Court said:
“In Heller, we held that the Second Amendment protects the right to possess a handgun in the home for the purpose of self-defense. Unless considerations of stare decisis counsel otherwise, a provision of the Bill of Rights that protects a right that is fundamental from an American perspective applies equally to the Federal Government and the States. We therefore hold that the Due Process Clause of the Fourteenth Amendment incorporates the Second Amendment right recognized in Heller. (Alito, 2010, p. 44)
- 2016 - Caetano v. Massachusetts, 577 U.S. ___ - The Supreme Court unanimously ruled that the Second Amendment extends to all forms of bearable arms:
The Court has held that the Second Amendment extends, prima facie, to all instruments that constitute bearable arms, even those that were not in existence at the time of the founding, and that this Second Amendment right is fully applicable to the States. (Volokh, 2016)
What the Massachusetts decision did was uphold a law banning stun guns. Their reasoning was three-fold. The first two, however, involved the same issue, stun guns were not around in the 1700s and consequently were also “unusual” – one of the exceptions in Heller. The court found that Heller specifically covered these objections that stun guns “could” be considered “bearable arms” and therefore protected. The third reason that the Massachusetts Supreme Court used was that stun guns were not readily adaptable to military use. Justice Alito, who wrote the opinion, found that Heller clearly protected any bearable weapon useful for self-defense.

Is There Really a Problem?
IT IS OCT 1, 2015 AND HERE WE GO AGAIN, AND AGAIN, AND AGAIN, ... eleven more ... AND AGAINs; repeated fifteen times since President Obama first got in front of a podium to commensurate with the nation on a similar mass murder to that at Umpqua Community College. The question is … COULD THIS ONE HAVE BEEN PREVENTED WITH REASONABLE, SANE GUN REGULATIONS? – There is no doubt in my mind that some of the others could have been, if not this one.
At about 10:40 AM on Thursday, Oct 1, 2015, eight students, ages ranging from 18 to 59 and their 67-year-old professor, were killed by Chris Harper Mercer, a young, obviously deranged man who apparently had a vendetta against Christians. The location, another school, Umpqua Community College in Oregon. Many were shot dead because they admitted to Mercer they were Christian.
AND AGAIN and again - it is now May 24, 2022, and another mass killing, the second in two weeks, happens at Robb Elementary School in Uvalde, Texas where a disgruntled 18-year old took his AR-15 style weapon of war and murdered 19 fourth graders (18 more were injured) and two teachers (while the local police were apparently too afraid to go in and take him out). The previous one was an 18-year old white racist who took his AR-15 style weapon of war to mow down 10 Black people and wounded 3 more.
This killing spree adds to the tally in a country where people killed by guns is 19.5 TIMES HIGHER than in similar high income countries!
To name just a few of the most recent ones (I hope you have time because sadly, the list is VERY long, even starting from 1999):
- 4/20/1999 - 15 dead at Columbine HS in Littleton, CO
- 7/29/1999 - 13 dead in Atlanta, GA
- 9/15/1999 - 7 dead at Wedgewood Baptist Church, Ft. Worth, TX
- 12/26/2000 - 6 dead in Wakefield, MA
- 7/8/2003 - 7 blacks dead plus white murder in Meridian, MS
- 3/12/2005 - 9 dead at Living Church of God in Brookfield, WI
- 3/21/2005 - 12 dead at Red Lake Senior HS in Red Lake, MN
- 3/26/2006 - 7 dead in Seattle, WA
- 10/2/2006 - 5 girls dead plus the murderer at an Amish school in Lancaster, PA
- 2/12/2007 - 5 dead in Salt Lake City, UT
- 4/16/2007 - 32 dead at Virginia Tech College in Blacksburg, VA
- 12/5/2007 - 10 dead in Omaha, NE
- 2/7/2008 - 7 dead in Kirkwood, MO
- 2/14/2008 - 7 dead at Northern Illinois University in DeKalb, IL
- 3/28/2009 - 8 dead in Carthage, NC
- 4/3/2009 - 14 dead at immigration center in Birmingham, NY
- 11/5/2009 - 13 dead at Ft. Hood, TX (terrorism)
- 8/3/2010 - 9 dead in Manchester, CT
- 1/8/2011 - 6 dead, including one 9-year old girl, and the wounding of Rep Gifford in Tucson, AZ
- 9/6/2011 - 5 dead in Carson City, NV including 3 National Guard soldiers
- 10/14/2011 - 8 dead in Seal Beach, CA
- 2/27/2012 - 3 dead at Chardon HS in Chardon, OH
- 4/2/2012 - 7 dead at Korean Christian Center in Oakland, CA
- 4/6/2012 - 3 blacks dead in Tulsa, OK
- 5/29/2012 - 6 dead in Seattle, WA
- 7/20/2012 - 12 dead in Aurora, CO theater
- 8/5/2012 - 7 dead at Sikh Temple in Oak Creek, WI
- 9/12/2012 - 6 dead in Minneapolis, MN
- 12/11/2012 - 3 dead in Clackamas, OR
- 12/14/2012 - 20 children and 7 adults dead at Sandy Hook Elementary in Newtown, CT
- 7/6/2013 - 6 dead in Santa Monica, CA; most at Santa Monica College
- 9/16/2013 - 13 dead at Washington Naval Yard, DC (not terrorism)
- 4/4/2014 - 4 dead at Ft. Hood, TX (not terrorism)
- 5/23/2014 - 7 dead at University of California, Santa Barbara at Isla Vista, CA
- 6/18/2015 - 9 blacks dead at Emanuel African Methodist Episcopal Church, Charleston, SC. Motive - white supremacy
- 10/1/2015 - 9 dead at Umpqua Community College, Roseburg, OR
- 11/27/2015 - 3 dead at Planned Parenthood facility in Colorado Springs, CO. Motive - religious, anti-abortion extremism, mental illness
- 12/2/2015 - 14 dead at Inland Regional Center in San Bernardino, CA - the first act of terrorism on American soil by an American since Oklahoma, OK. Motive - home grown ISIS sympathizer
- 6/12/2016 – 49 dead at the Pulse nightclub in Orlando, FL – second act of home-grown terrorism. Motive - white supremacy
- 7/8/2016 – 5 Dallas, TX police killed and 9 wounded in retaliation for a suspicious police shooting of a black man in another state
- 7/17/2016 – 3 Baton Rouge, LA police killed and 3 wounded in another retaliation for an alleged police shooting of a black man in the city earlier in the month
- 7/23/2016 – 4 dead and one child killed in an apartment complex in Bastrop, TX
- 8/6/2016 – 4 dead including three children as well as the shooter in a murder-suicide in Reading, PA
- 9/23/2016 - 5 dead at a Macy's department store in the Cascade Mall in Burlington, WA. Motive - possibly related to home-grown ISIS-inspired terrorism linked with mental illness.
- 1/6/2017 - 5 dead, 8 injured at the Ft. Lauderdale-Hollywood International airport in Ft. Lauderdale, FL. Motive - mental illness.
- 10/1/2017 - 58 dead and injured more than 500 more in Las Vegas, NV at an outdoor event. Motive - unknown.
- 11/5/2017 - 26 people killed and another 20 wounded at the First Baptist Church in Sutherland, TX. Motive - dispute with mother-in-law and mental illness.
- 2/14/2018 - 17 kids and staff members killed with another 17 were injured at the Stoneman Douglas High School in Parkland, FL. Motive - disgruntled student and mental illness.
- 5/18/2018 - 10 dead and 13 wounded at Santa Fe High School in Santa Fe, TX. Motive - being bullied at school
- 6/28/2018 - 5 killed at the Capital Gazette in Annapolis, MD by an unhappy reader. Motive - unhappy with a story (mental illness)
- 8/20/2016 – 6 family members dead in mass shooting in Citronelle, AL
- 9/11/2016 – Ft. Wayne, IN was where 3 people died from gunshots plus an unborn child, another person was injured in a domestic dispute
- 10/27/2018 - At the Tree of Life Synagogue, 11 people were killed and 6 others injured in Pittsburg, PA. Motive - white supremacy
- 11/7/2018 - 12 people dead and 18 injured at a Bar and Grill in Thousand Oaks, CA. Motive - unknown, possible PTSD
- 2/15/2019 - 5 people killed and 5 more wounded at a plant in Aurora, IL. Motive - disgruntled worker
- 5/31/2019 - 12 people killed and 6 others wounded in a municipal building in Virginia Beach, VA. Motive - disgruntled worker
- 7/28/2019 - 4 dead and 12 injured at the Gilroy Garlic Festible in Gilroy, CA. Motive - white supremacy.
- 8/3/2019 - 22 dead and at least 24 wounded at a Wal-mart in El Paso, TX. Motive - white supremacy.
- 8/4/2019 - 9 dead, including the gunman's sister, at least 27 others wounded in the Oregon District of Dayton, OH. Motive - unknown
- 8/31/2019 - Midlands-Odessa, TX; 6 dead (including the shooter) and 21 injured (3 police) after a traffic stop of a heavily armed man; Motive - unknown
- 10/14/2019 - San Juan, Puerto Rico; 6 dead after a shootout at an apartment complex.
- 10/31/2019 - Orinda, CA; 5 dead and 4 wounded at a block party shootout
- 11/14/2019 - Santa Clarita, CA; 3 dead and 4 wounded at Saugus High School
- 11/17/2019 - Fresno, CA; 4 dead and 6 wounded at a football watch party
- 12/5/2019 - Miramar, FL; 4 dead and 1 wounded at a jewelry store robbery gone wrong.
- 12/6/2019 - Pensacola, FL: 4 dead and 8 wounded at the Navel Air Station there.
- 12/10/2019 - Jersey City, NJ: 6 dead and 3 wounded as a result of a police chase and shootout. The suspect was a Black Hebrew Israelite who was targeting other Jews.
- 1/17/2020 - Grantsville, UT; 4 dead and 1 wounded because a teenage son shot and killed most of his family as they returned home.
- 2/26/2020 - Milwaukee, WI; 6 dead from a disgruntled ex-employee
- 3/15/2020 - Springfield, MO; 5 dead and 2 wounded when a gunman opened fire at a convenience market.
- 8/9/2020 - Washington D.C.; 1 dead and 21 injured This was another block party gone wrong.
- 9/19/2020 - Rochester, NY; 2 dead and 14 wounded at another party.
- 11/3/2020 - Henderson, NV; 4 dead and 1 wounded when a gunman opened fire at an apartment complex
- 11/20/2020 - Wauwstosa, WI; 8 wounded in a mall shooting spree.
- 12/26/2020 - Rockford, IL; 3 dead and 3 wounded in a bowling alley shooting.
As of Sep 17, 2016, there were 346 mass shootings with 454 dead and 1249 injured. As terrible as all the statistics above are, they are only a small part of the problem, In fact, the political murders listed probably have nothing to do the rate of gun ownership.
(As of August 9, 2019, those totals increased by another 16 mass shootings with a total of 204 killed and over 650 wounded.)
The real problem with the availability of guns are the deaths that are self-inflicted. They represent over 50% of all deaths from guns. We will review this sad fact in Part IV.
HAS A MASS MURDER HAPPENED NEAR YOU? (the odds are getting better)

OCTOBER 1, 2015 - Chris Harper Mercer murdered 8 students and teachers plus himself
JUNE 18, 2015 - Dylan Roof murdered nine black parishioners and pastors in a racially motivated rampage
MAY 15, 2015 - Elliot Rodger murdered 6 people, 3 by stabbing and 3 by shooting, on and off campus before killing himself
APRIL 4, 2014 - Army Specialist Ivan Lopez murdered three soldiers on the base before killing himself. This was not terrorist related.
SEPTEMBER 6, 2013 - Aaron Alexis murdered 13 people on this installation. Aaron was black, a rarity in mass murderers.
JULY 7, 2013 - John Zawahri murdered five people before killing himself
DECEMBER 14, 2012 - 20 children and 6 adults were gunned down before Adam Lanza killed himself in the second worst school shooting in America
DECEMBER 11, 2012 - Jacob Tyler Roberts murdered two people before killing himself after he failed to reload his rifle.
SEPTEMBER 24, 2012 - Brian Mawr murdered five people before killing himself at a workplace shooting
AUGUST 5, 2012 - White Supremacist Wade Mitchell Page murdered six people before killing himself in a racial and religious shooting spree
The Myth of Guns Don't Kill People, People Kill People
This is a ubiquitous bumper sticker and sound bite used by those for unrestricted gun rights. It is supposed to mean that since guns themselves, on their own volition, do not kill people then there is no reason to regulate guns. The same exact claim can and was made about cigarettes by the tobacco companies before them. Of course this propaganda is the height of nonsense as well as pure deception. Everyone understands it is people “using guns” that kill other people or themselves; the gun does not willingly or unwillingly (it can do neither) pull its own trigger. Nevertheless, those who favor little of no regulation of gun ownership would have you believe is the argument of their opponents in this battle to save lives. Consequently, all unbiased observers should understand that it is the people’s ownership of guns that should be regulated in order to reduce death from there use.
HOWEVER, there is a caveat to that last claim. It is useful to regulate gun purchases if and only if there is evidence to show that doing so has a reasonable likelihood of reducing the total number of people killed from the use of a gun. If that “relationship” cannot not be “reasonably” established, then there is no purpose for any regulations.
A Word About Proof vs Relationship
Back in the 1960s, I can remember running down to the corner grocery to buy a pack of Newport menthol cigarettes for my young friends and I to smoke like so we could act like adults. We fooled ourselves into thinking this was beneficial to us as well because that is what the “doctor” in the white told on TV. According to this advertising from the cigarette companies (I can still remember this 56 years later) smoking was actually medically healthful for my throat.
Back then, the only people who knew the link between smoking and bad health were the makers of tobacco products and scientists trying to establish the linkage; in fact, both knew beyond the shadow of a doubt such a “causal” relationship existed by the time my friends and I were smoking and watching cigarette ads. Since the late 1800s, study after study began showing strong statistical evidence that smoking is “related” to cancer. Unfortunately, until the 1950s, there were mostly very strong statistical correlations to support this view and only a few causal statistical studies. The former statistics did not “prove”, in and of themselves, that smoking caused cancer … they only suggest it. The statistical and biological work (more recently DNA) finally accumulated enough of the right kind of evidence to prove the linkage; that is when the Surgeon General finally issued his famous warning.
Proving the linkage is highly complex and not easily communicated to lay people. Consequently, the tobacco manufactures were able to duck and weave by asserting there is no “proof” cigarettes causes’ cancer, even though they knew better and the Surgeon General said so.
So it is with the NRA leadership, which is why I take the time to develop this information for you. The statistics presented in this book are designed to show “possible” relationships between variables that logically play in this dance between 2nd Amendment rights and saving lives. If we find a strong relationship, then that ought to prompt deeper investigation, using different statistical methodologies, to prove such a linkage. While I do consider many possible variables, the one I hope to “show” the reader is that there IS a strong relationship between regulating the purchase of firearms and the rate at which people die from their use.

Gabriel Giffords and Sandy Hook Elementary
Both were senseless massacres perpetrated by mentally disturbed people who had access to guns. I began writing about gun violence and gun control (not abolishment) with the Gabriel Giffords' massacre. I presented several charts and statistics in http://myesoteric.hubpages.com/hub/Gabrielle-Giffords-and-Gun-Control to highlight, as well as strongly suggest, the proportional relationship between the number of guns available (as a rate) and the rates of death from guns and that the number of guns available in a state is indirectly proportional to the strength of that states gun regulators.

The bottom line that I hope to suggest strongly is that:
The higher the per capita ownership of guns in a state with poor regulations means there is a statistically-significant greater chance for a higher per capita number of deaths (of all types and reasons) by gun in that state when compared to a state with better regulations.
This relationship is intuitive to non-gun owners and those who believe in gun control, but hotly denied by the NRA and many of its members. In fact, gun owners proclaim that higher per capita gun ownership is inversely proportional to violent crime and homicide by gun rates. They argue that if everybody was armed, there would be less crime because criminals would fear getting shot by armed citizens (they ignore, however, unarmed citizens getting shot by armed citizens). Further, gun proponents assert that the higher rate of gun ownership has no bearing on the total number of suicides believing that if somebody can't kill themselves by gun, because of lack of availability, they will always do it by some other means. These are nice theories, but demonstrably incorrect; which is what future parts of this hub series is determined to prove to any freely thinking person.
This Just In From Twitter
8/3/14: I AM NEW TO TWITTER BUT FIND MYSELF ENJOYING IT immensely. It is full of facts (like what I am about to present), nuts, dirty words (some of which are new to me after 66 years of thinking I have heard it all), very smart people, and very ... eh not so smart ones.
Anyway, the link below is to is some 2012 research which, once you read it, is obvious, but nevertheless hadn't occurred to me yet. Further, it bears directly on the issue of #MoreGunsMoreDeaths; the Twitter hash tag I created to find my posts on the subject.
Psychologist James Brockmole and his team from Notre Dame conducted research on the Impact of " ...Holding a Gun Has on People's Perceptions." Basically, what they did was have people 1) hold a gun, 2) hold some other small object, or 3) have a gun in sight, but not holding it. Then these people watched images flash on a computer screen who were also holding an object, which might or might not be a gun; they were asked to identify the object. The conclusion of the researchers, after controlling for all sorts of variables and biases, is that the mere fact that a person is holding a gun will influence their perception that someone else is holding one as well. This was not the case if the person was holding some other object or just had a gun in sight. The logical follow on from this study, of course, is that the rate of death by gun goes up the more people are walking around with guns because the rate of "false positives' (people perceived to have a gun, but don't) increase leading to a shooting.
A Word About Statistical Analysis
All statistics really is, is gathering a set of data and analyzing it for patterns of behavior between two or more sources of that data. It can be seemingly silly like comparing phases of the moon and stock prices where the hypothesis is that moon phases “causes” stocks to act in a certain way[1]. Or, they can be deadly serious such as seeing if a certain dosage of a new medicine will save lives. Nevertheless, at the end of the day, all statistics will do is find relationships or the lack thereof. The robustness and transparency of the methodologies used determines the veracity of any statistical analysis. This is why I present HOW I came to my conclusions, rather than just telling you my answers. It is also why statistics are so hard to understand by so many people, including those fortunate enough to be fluent with numbers[2]. The methods used to parse data are often obtuse and complex and sometimes counter-intuitive. But done properly and honestly, they are as legitimate as the times tables (that was the way they use to teach multiplication before the “new” math, lol.)
While I do use moderately sophisticated statistical techniques, ones I used in my work with the Air Force, my goal is to try to explain as best I can, in non-mathematical terms, how and, more importantly, why they work. Having said that, in accomplishing the research for this book, I was taken aback from not finding any studies, major or minor, that considered more than two independent variables (two things that might influence gun deaths) in their investigation. In almost all cases each analysis was some variation of the rate of gun ownership versus some other variable that one might think it influences, mainly violent crime. But that is not real life is it; rarely, when talking about natural processes, is the relationship between two variables so strong as none others need to be considered (such as population density and temperature).
Therefore, while I am sure my approach of using multiple variables is probably not unique, it is the only one that I know of at this point in time. My fervent hope for this book is to inspire those more talented than me to pursue such multivariate analysis.
OK, let’s begin.
[1] Yes, there actually are such studies; you can Google it. What they found, however, was a correlation, not a cause. More work would be needed to see if moon phases affects the mind and if it does it in a way that affects investing decisions.
[2] Do not be embarrassed if mathematical concepts beyond simple arithmetic are strange to you and hard to understand, you are not alone. Over 60% of Americans cannot handle doing some type of math, including estimating distances or weight, figuring out how much savings they need for retirement, and calculating tax (In a New Survey, Americans say, “We’re Not Good At Math”, 2016). This is not from being lazy, not by any stretch; it is simply that most of our brains are not wired from the get-go to easily handle that kind of abstract thinking.
Comparing Levels of Gun Ownership and Levels of Gun Deaths
The simplest comparison we can make, wrongly, is looking at the number guns by state and the number of deaths by gun in that same state. I say “wrongly”, not because it produces bad results, but because, except for extraordinary circumstances, it must prove our hypothesis that if there are more guns in a population, then more people will die from their use. Table 1.1 presents data for the five states with the most guns in it and the five states with the fewest guns in it sorted by number of guns.
Levels of Gun Ownership and Gun Deaths
RANK
| STATE
| GUN OWNERSHIP - 2013 (000)
| GUN DEATHS - (000)
|
|---|---|---|---|
1
| TEXAS
| 9,495
| 2,830
|
2
| CALIFORNIA
| 8,165
| 2,837
|
3
| FLORIDA
| 4,790
| 2,249
|
4
| PENNSYLVANIA
| 4,433
| 1,341
|
5
| NORTH CAROLINA
| 4,067
| 1,162
|
46
| WYOMING
| 348
| 94
|
47
| VERMONT
| 263
| 65
|
48
| DELAWARE
| 236
| 103
|
49
| HAWAII
| 234
| 37
|
50
| RHODE ISLAND
| 135
| 32
|
TABLE 1.1
The first thing one does in this kind of analysis is eyeball the data for patterns. A quick glance at Table 1.1, seems to indicate a pattern exists. Specifically, as the number of guns in a state increases, so does the number of death by guns. This would seem to confirm arguments made by gun safety advocates. But that said, this data might show a "correlation", but it says nothing yet about "causation".
A closer look at the information reveals some differences as well. For example, Texas has numerically more guns than California, yet California has a few more deaths by gun. Another example is comparing California with Florida. Florida has almost half the number of guns than California, yet it still has almost as many deaths as California (80%,to be more precise). Finally, look at Florida and Pennsylvania. They have roughly the same population but Pennsylvania has many fewer deaths – why? We do not know and cannot tell from simply looking at this data.
If you think about it, however, how can the answer be anything other than what it is? So, is my book finished? Of course not, because this data is answering the wrong question, especially given the right to bear arms is sacrosanct in America. Absent the Second Amendment, the simple solution is to ban all legally owned guns. That would guarantee that death from legally owned guns would drop to zero, wouldn’t it; how could it not? The only deaths from guns that could occur are from those possessed by criminals. It is interesting to note that gun deaths from this source would also decrease given the difficulty for criminals to get their hands on firearms.
But in our society, banning guns is simply not going to happen. So, the REAL question is “can regulating who can get a gun and under what circumstances result in fewer deaths from legally owned firearms?” To answer THAT question, one must try to figure out if gun regulations can accomplish this goal. This book is intended to show that it can.[1]
So, if comparing magnitudes of things doesn’t do the trick, what does?[3] The answer to that is comparing rates, i.e., the magnitude of one thing per a unit of something else; e.g., miles per hour. The first question we need to ask is if we compare the rate of death in a state from guns vs the rate of death from guns in another state, will we find a significant difference, and if so, why?
If things are as gun rights advocates suggest, then when comparing state-by-state (stratified analysis) differences in rates of death from guns per 100,000 population (X) with rates of gun ownership per 100,000 (Y), are the results randomly distributed, i.e., there would be no discernible pattern. In statistics, this is called the null hypothesis, H0, is there is no correlation between X and Y.
The fact is, however, when we compare these two variables across all 50 States, there is a pattern. Moreover, if there is a pattern, that means something is going on; the challenge is to find what it is.
[1] Because it is self-evident, I am not going to actually prove the data in Table 1.1 shows that more guns[2] in circulation means more deaths from their use will occur.
[2] From here on out, when I use the terms “guns, firearms, weapons” are similar synonyms, I am referring to the type of weapon that is subject to the Second Amendment and are legally owned.
[3] Magnitudes are useful when comparing sizes of similar things, e.g. state populations, number of guns in a state. What is unfortunate is people use this simple idea when comparing unequal things like death and guns and deny that looking at rates of things has any meaning at all.
Statistical Term # 1 – Normalization
Let me bring up a statistical term at this point; “normalization”. In order to put data from different settings on equal footing, you do this by “normalizing” it. In our case, we don’t want to work with total deaths per state and total guns per state because we have already seen that doesn’t lead to useful analysis[1]. What we want to do is make these numbers comparable; and we do that by dividing each by a common factor … population, in this case. You see, when you say Florida (population 20 million) has 2,200 annual deaths from guns and Hawaii (population 1 million) has 37, what can you say about the relative number of deaths[2]? Only that one is larger than the other and nothing more. But, if you say Florida has 11.5 deaths per 100,000 population and that Hawaii has 2.6, THEN you have something to talk about, namely why does Florida have 5 times as many deaths from guns per 100,000 than Hawaii, which has 20 times the population (and guns, as it turns out)? Good question.
So, without normalization, it is often impossible to compare a number from one group with that of another. Why? Because without normalization you cannot control for the influence of other factors, say state populations. When you do normalize data, it often reveals information that is otherwise hidden. Therefore, the problem with Table 1.1 is then is the data is not "Normalized"; i.e, each data set was NOT divided by the common factor between the two sets, in this case population.
Why am I spending time tell you all of this statistical nonsense? Because, there are many non-statisticians who are very suspicious when we start messing with the original data even though such manipulations are required to tease out the real meaning. To demonstrate, look at Table 1.2.
[1] This isn’t quite true, if the states were the same, e.g. same populations, same sizes, then we could work with total numbers, but they aren’t and therefore we can’t.
[2] The number of deaths are fictitious, but the populations are not.
CORRELATION BETWEEN GUN OWNERSHIP AND GUN DEATHS - 2013
RANK
| STATE
| % GUN OWNERSHIP
| GUN DEATHS/100,000
|
|---|---|---|---|
1
| WYOMING
| 59.7
| 16.2
|
2
| ALASKA
| 57.8
| 19.2
|
3
| MONTANA
| 57.7
| 16.1
|
4
| SOUTH DAKOTA
| 56.6
| 10.3
|
5
| WEST VIRGINIA
| 55.4
| 14.6
|
46
| CONNETICUT
| 16.7
| 5.0
|
47
| HAWAII
| 16.7
| 2.6
|
48
| RHODE ISLAND
| 12.8
| 3.0
|
49
| MASSACHUSETTES
| 12.6
| 3.2
|
50
| NEW JERSEY
| 12.3
| 5.3
|
TABLE 1.2
Two things immediately pop out at you, 1) there is a significant difference in rates of gun ownership in each state listed and 2) there is a similar significant difference in the rates of death from guns in the various states. A third result may also be obvious to you, the higher the rate of gun ownership, the higher the rate of deaths from guns.
CORRELATION BETWEEN GUN OWNERSHIP AND GUN DEATHS - 2020
RANK
| STATE
| % GUN OWNERSHIP
| GUN DEATH RATE per 100,000
|
|---|---|---|---|
50
| MISSISSIPPI
| 55.8
| 28.6
|
49
| LOUISIANA
| 53.1
| 26.3
|
48
| WYOMING
| 66.2
| 25.9
|
47
| MISSOURI
| 48.8
| 23.9
|
46
| ALABAMA
| 55.5
| 23.6
|
5
| NEW YORK
| 19.9
| 5.3
|
4
| RHODE ISLAND
| 14.8
| 5.1
|
3
| NEW JERSEY
| 14.7
| 5
|
2
| MASSACHESETTES
| 14.7
| 3.7
|
1
| HAWAII
| 14.9
| 3.4
|
Statistical Terms #1 and #2
Statistical Term #2 – Independent Variable: a variable whose value is not dependent on any other variable in the analysis.
Statistical Term #3 – Dependent Variable: a variable whose value is dependent on the independent variable and possibly other dependent variables as well.
In this analysis, the rate of gun ownership is the Independent Variable, while the Dependent Variable is the rate of deaths from guns. So, in considering Table 1.2, what is seems to suggest that as the rate of ownership increases, so will the rate of deaths; INDEPENDENT of the population in each State or the number of guns in each State.
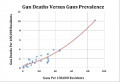
OK, it is clear from Table 1.2 that, at least for these 10 States there seems to be a correlation between the rate of gun ownership and the rate of death from guns. But, how about all 50 States? What does that suggest? I won’t bore you with a table of values here (they are in the appendices) But, what I will offer you is a picture (Figure 1.1) of that data. As with all graphs like this, the vertical line (y-axis) is the Dependent Variable (the rate of death) and the horizontal line (x-axis) is the Independent Variable (rate of gun ownership). Each dot on the graph represents this pair of values for each state.
Figure 1.1 Rate of Death vs Rate of Gun Ownership

Initial Trial Runs
Figure 1.1 is the first attempt to determine if such a relationship as I suggest really exists between firearm ownership rates by State and death due to firearms by State. If you had observed in the graph above no pattern whatsoever in the dots above (meaning if you drew a line through the center of them, it would be flat) then that is strong evidence no such relationship exists. On the other hand, if you do see a pattern, i.e. the imaginary line tilts up or down, then that means there is a possible correlation, which should therefore be investigated further. And indeed, that is what we see, a distinct upward tilt.
The next step is to determine “how strong” the possible association is. One way to do this is to figure out how often a change in the independent variable will lead to a predictable change in the dependent variable. There are three possibilities; 1) they change in the same direction, 2) they change in opposite directions, or 3) the change is random. In our case it would appear the change is in the same direction and that direction is positive (point up when viewed from left to right). To figure this out, we can use a fairly simple statistic which has the imposing name of the Pearson Product-Moment Correlation Coefficient.
Statistical Technique #1 – Pearson Product-Moment Correlation Coefficient: this test measures how closely the differences between is X-value and the average of the X-values matches the differences between is Y-value and the average of the Y-values. If these differences match perfectly, value for value, then 1 is the answer (or -1 if X and Y are opposite of each other). If there is no apparent pattern to the differences, the answer is 0. Obviously, the closer the answer is to 1 or -1, the stronger the two variables are related. Further, the strength depends on the number observations we have (50 in this case, one for each state). The more samples (observations) there are, the smaller the answer can be and still be significant.
Using the data that produces Figure 1.1, and doing the arithmetic, the answer you get (designated “r”) is 0.75. With 50 samples, this very significant result implies there is a definite relationship between the rate of gun ownership and the rate of death from guns; and a strong one to boot.
But we can’t stop there and declare victory, not by a long shot (otherwise this would be a very short book). Rather than as the question of IS there a connection, the question becomes why is it there and what is driving it?
So we will.
What is needed is a way to estimate the value of the dependent variable given we know the value of the independent variable. That is to ask, can we predict the rate of death from guns if we know the rate of gun ownership. One of the most popular ways of doing this is the statistical technique of Regression or more specifically Linear Regression.
Statistical Technique #2 – Linear Regression: A more detailed explanation of this technique is offered in Appendix ???, but suffice to say at this point that linear regression is a mathematical method of drawing a straight (hence linear) through the pattern of dots in Figure 1.1 such that the average of the distances between each dot and the line is minimized. That means if you draw a line from each dot perpendicular to some arbitrary line, add up all those distances and divide by the number of dots (to get an average distance), then the line that produces the smallest average is the line we are looking for.
Then, if you extend that line through the y-axis and read off the value there and calculate the slope (the degree of tilt) of the line, then you have an equation that will predict the value of “y” given the value of “x” Not to scare you with algebra, but in symbols, that is Y = a X + b, where “a” is the slope of the line and “b” is where the line intersects the y-axis.
Figure 1.2 is what results if we regress X against Y.
 - GRAPH 4")
Figure 1.2 is the first figure with the optimal line drawn through it using the technique of linear regression. To understand this chart fully, you need to notice that the dots are scattered all about our line, quite a lot it would appear. Nevertheless, they do follow the trace of our line. The question is, how well does it do that?
Statistical Term #4 – Coefficient OF Determination (R2): This statistic indicates how well those dots line up with the line. It can take on values between 1 and -1 where the extremes mean a “perfect correlation” (all of the dots fall on the line); this only happens in “canned” sets of data. A zero would mean the two variables have nothing to do with each other. Now you need to know this R2 is only an estimate, it is only “probably” correct.
But, the way this is most often calculated, it has a high probability (95%) of being right. Finally, the threshold value of R2 that is most commonly used to say we have a good equation is 0.70. What does THAT mean? This tells you, at a high probability, how much of Y is explained by X, or, in our case, how much of Death Rate by Gun is explained by Ownership Rates of Guns? Therefore, an R2 of 0.70 says 70% of the DeathRate is explained by Ownership Rate.
Boy, I hope that is understandable because if you do, then you will have much more confidence in the conclusions I come to in this book.
Let us turn to Figure 1.2 and look at it more detail (and maybe the explanation of linear regression will make more sense). The line you see is the “line of best fit”, meaning it minimizes the “error” (the distance between the dot and the line). The equation in the lower right is Y = 0.2417X + 2.2912. Breaking this down, that equation tells you:
- When the legal gun ownership rate is Zero, the theoretical death rate from guns is still 2.2912 deaths from guns per 100,000 (this is where the line would cross the y-axis). This is understandable given not all guns are legally owned.
- That as you increase legal gun ownership rate by 1% point, then the death rate from guns increases 0.2417 deaths per 100,000 population.
- That if we pick an arbitrary legal gun ownership rate of say 40%, then we would estimate that the death rate from guns is around 12 per 100,000. (In fact, the actual data shows that if ownership rates are between 35% and 45%, then death rates are between 6.9 and 19 while the total range is 12% to 60% for ownership and 2.6 and 19 deaths per 100,000)
In my mind, those death rate values seem pretty far apart for only a 10% change in ownership. So what do I do? I turn to my R2 to see how “tight a fit” my equation is. At 57% (0.5705), I can see that it isn’t. I read that number to mean that only 57% percent of deaths from guns is explained by gun ownership. Turn that around you can say other factors explain 43% of the deaths.
Said another way, the low R2means either that 1) there is relatively little correlation between the two variables (something that gives heart to gun proponents) or 2) there must be some other factors involved (which actually is the case). By observation, however, even with the broad scatter of dots, the upward sloping trend line appears clear. Consequently, we are well on our way to establishing a statistical correlation between rate of gun ownership to the rate of deaths by gun for all causes.
But, we can't leave it there, can we; what about the other 43%? What else could be going on? Well, if you look at Fig 1.3, I highlighted some data points that appear to be outliers (data showing very unusual characteristics). I noticed that many of the states who appear to be outliers are states with low population densities.
Figure 3.3: Outliers from Figure 3.2

That got me to wondering if sparse or overcrowded populations could somehow affect how often people use guns to kill other people or themselves. So, to control for that variable (remove its effects) I divided "density per square mile (c) ", from Table 1.3, into the rate of deaths by gun per 100,000 inhabitants (d), from the same table). So I did, without removing the outliers[1]; the result is Figure 1.4
[1] You only remove outliers if the cause unwanted effects AND they are not germane to the overall analysis. You will see an example of that in a moment
Figure 3.4: Density Normalized Ownership Rate vs Gun Death Rate

What a strange looking graph. Two things stand out, 1) Alaska sits way above all the rest and 2) the trend line goes below zero deaths per 100,000, an impossible out come. Other than that, the dots “seem” to line up in an apparent linear fashion; which is a good thing for our calculations. The problem is, it is not linear.
To see this, we must remove the outlier, AK. Now, you can’t go doing that without a very good reason; and we have one. The land mass is so large and the population is so small, you end up with a population density that is not even remotely similar to the other 49 states. So let’s remove it and see what happens. Figure 3-5 is what happens.
Figure 3-5: Density Normalized Ownership Rate vs Gun Death Rate w/o Outliers

Here we see the outlier problem is gone[1]. Things, however, are not all milk-and-honey because we still have the trend line dipping below zero, and that is not a logical outcome, is it. It gets worse when you look at the R2 ; it is 0.2799 and that is flat out terrible. I might as well just throw the whole thing out and say I failed to prove my case. What to do? Well, if you look at the graph from left to right, it seems to me you can draw a curved line through pattern of dots that should “fit” a lot better than a straight one does.
In keeping with my promise not to turn this book into a course in statistics, let me just say there are ways to fit all sorts of different types of lines and curves through a set of data. The one you are looking at is called an “exponential” curve which as the properties of starting out with small increases and ending up with large increases. Figure 3-6 demonstrates this.
[1] Granted, the two dots in the upper right corner “appear” to be outliers, but because they are so much closer (three times as much rather than AK’s 12 times) it is simply too soon to tell
Figure 3-6: Density Normalized Ownership Rate vs Gun Death Rate with Exponential Trend Line

AHH, AT .67, WE HAVE A MUCH BETTER R2, meaning I made a good decision in picking population density as another important variable to normalize for and to draw an exponential line through the dots. In addition, we can see that the two states in the upper right corner of the previous graph do not look so strange after all (if you keep extending the curve up).
There is one small problem with Figure 3.6, we do not want a curved line, we want it to be straight; otherwise our formulas based on straight lines won’t work. Such is the problems of statistical analysis, but, we are not down and out because there are several ways to skin this cat.
THE MAGIC OF TRANSFORMATION
THIS IS BY FAR THE HARDEST CONCEPT FOR non-statisticians to grasp. Nevertheless, data transformation is a standard statistical method to make the data more amenable to analysis. It is also where people start raising their eyebrows and begin wondering if some wool is being pulled over their eyes; my wife is one of those skeptics. Further, transforming data is one place other statisticians drill down on before if they doubt the results. OK, now I have mentioned the word “transformation” several times without telling you what it really means.
Statistical Technique #3 – Data Transformation: Applying a function (just wait, I’ll explain) uniformly to a set of data to change it into another set of data which can then be more easily worked with. More simply for our purposes … straightening out a curved line in order to perform linear (i.e., straight) regression on the data.
For example, let’s say you have a set of data points that are composed of the values 1, 10, 100, 1000; clearly this is not a linear set of numbers (one is ten times the previous one) and will complicate your statistical life immensely. To fix it you would apply something called a “log” transform (don’t worry about what this is if you don’t know). If you do, then you would know the result is 1, 2, 3, 4; and that IS a straight line. So now you can go on your merry way with your calculations. You just have to remember that when you are done, you need to transform your answers back to the original form. In Appendix ??, you will find an example.
While there are many possible transforms available to try, some better in one situation and another better in others, I chose the Box-Cox Transformation; if you want the math and theory behind it you can go to (Box-Cox Transormations, n.d.)[1] I selected it because it is a essentially a universal technique adaptable to many types of data sets and it was something I could build version in MS Excel to do my calculations. While it is not necessary to go into the mathematics or explain how it works (unless you really want to know), it is sufficient to assert that properly used, it does a wonderful job of straightening out curved lines. I will apply it to all of the data sets I use; and in some cases, it returns the original values because they were linear to start with.
Finally, if I apply the Box-Cox methodology to the sample data I presented earlier, 1, 10, 100, 1000; the transformed data happens to be the same 1, 2, 3, 4 that came from the “log transform” I also suggested. So, if I plot this data then Figure 3.6 ends up looking like Figure 3.2.
[1] As a fun fact, this method was developed in a paper written by Professor George Box and another statistician named Sir Jeffery Cox in 1964. They decided to develop the paper because their names were so similar (who says statisticians can’t have fun).
Multiple Regressions Help Refine the Model
WHILE AN R2 OF .69 IS A GOOD RESULT, I can do better using the same data, and that is through a different statistical technique called "multiple regression". I won't show you more graphs for this particular comparison, but instead describe a little of what goes on with this kind of methodology.
If you recall, to reach the solution presented in Graph 4, we combined variables that seemed to have an effect on the result, namely 1) rate of deaths by gun in a state, 2) the population of the state, and 3) the density of that state population. Frankly, that is kind of clunky and hard to picture in ones mind. A much better way is to separate out the variables and regress each separately, so this is what I did.
For an example trial I used the rate of deaths by gun as my "Dependent" variable, the variable that depends on other factors. Then I used the % of gun ownership as one "Independent" variable, as I did before, plus two additional independent variables - 1) gun density and 2) population density; I also performed some "transformations" on each data set in order to produce a linear function (explained later). By looking at the problem in this manner we get a result where the "adjusted" R2 is .93, an exceedingly good result ("adjusted" meaning it takes in account the number of independent variables).
Using the Results in Understanding Gun Deaths
THE PURPOSE OF DOING REGRESSIONS isn't to see how nice an R2 we can obtain, but to produce a useful formula for predicting things, in this case the number or rate of deaths by guns. Be forewarned, from this point until the last couple of sections, I will be presenting and discussing the equations resulting from each of the regressions which were considered. If numbers aren't your thing, you might want to skip to the end.
ORIGINAL FORMULATION - Raw Deaths vs. Raw Guns:
For example, in Graph 1 we find the expression used to predict the Total Number of Deaths by Guns (Y) from % Gun Ownership (X) is .
Y = 0.0004X - 71.893.
This says that using our first equation, if I know X, then I can predict Y. So, let's pick on Maine and ask a question - "What if Maine relaxed its gun laws further and total ownership of guns increased 10% from 532565 to 585282, how many more deaths by gun should we expect?" BTW, I chose Maine because it was a "middle of the pack state whose data point is near the trend line in one of the regressions. If we apply the formula we would get:
Y = .0004 * 585282 - 71.893 = 234.1128 - 71.893 = 162.2 deaths, up from the original 85, a 91% increase, wow!
This is something isn't it? Well, no it isn't, given the type of variables used in the regression, Another reason is that the data point (85) for Maine in this regression falls somewhat below the trend line. if, however, we applied the formula to the original number of guns in Maine, we would get an answer of 141 predicted deaths, not the 85 deaths actually experienced in Maine.
So, the proper comparison of our result from the increase in gun ownership should be between the 141 predicted deaths for the baseline ownership and the 162 forecast after the increase; that results in a much more reasonable 15%.
FIRST REFINEMENT - Rate of Deaths vs. Rate of Gun Ownership:
Next, if we look at Graph 2, we see a different formulation when considering rates, in this case Deaths per 100,000 population (Y) and % Gun Ownership (X). Here, the expression is:
Y = 4.2298 * e 2.3224 * X.
The 'e' stands for exponential and is what results when we fit a curve to the data which, in this case, is better than using a straight line. Again, using our Maine example and evaluating a 10% increase in the rate of ownership from 40.5% to 44.6%, we find that by plugging into the formula, we get a prediction of::
Y = 4.2298 * e 2.3224 * .423 = 11.3, an increase of 74% from the original 6.5 deaths per 100,000.
This scenario suffers from the same problem we saw in the other graph, namely the original data point plots below the trend line. If we use the equation to plot the original point, our answer is 10.8, much closer to the new value and gives us a 5% increase in the rate of deaths.
I like this answer better in spite of the much lower R2 (.45 vs. .89). This is so because I know, as a statistician, that the formulation of Graph 2 make much more sense than that used for Graph 1 for it controls for a major sources of unwanted influence on our dependent variable, namely variations in population between states.
SECOND REFINEMENT - Rate of Deaths per Mile2vs Rate of Ownership:
The next refinement is represented by Graph 3, where we try to account for population density, thinking the more dense the population, the more likelihood of deaths by gun. The formulation normalizes for this effect and we get a new expression, Y = .2178 * e 10.469 * X, with a much better R2 (.68). Once more using Maine with a 10% increase in the rate of gun ownership, we obtain the following result:
Y = .2178 * e 10.469 * X = .2178 * e 10.469 * .423 = 18.3.
The original value for Maine was 15.1, a 21% increase in deaths, given a 10% increase in ownership rate. This example doesn't have the same problem we saw in Graph 1 or 2 where the original data point started below the trend line, because I purposely chose this data point to be right next to the trend line.
Notice further that the 21% increase in this formulation is quite a bit more than the 5% increase from the example without taking density into account. The expectation is that because the data more closely fits this regression than the previous one, the result is more reliable.
THIRD REFINEMENT - Using Multiple Regression:
Finally, let's consider the results from using multiple regression as our methodology, the one which considers more than one independent variable at the same time. In our case, the independent variables are 1) rate of guns owned in a state, 2) state population density, and 3) population density. From this we get the equation:
Ln(X) = .735 * Ln(A) + .185 * Ln(B) + .290 * e(1/C).
WHERE:
X = Rate of Death by Gun
A = % of firearm ownership for state in question
B = State population
C = The density of firearms in that state
The formulation with natural logarithms and e raised to a fractional power is driven by the shape and distribution of the original data. It allows us to consider each independent variable separate and, at the same time, make a linear regression equation.
So, sticking with our Maine Example and plugging in the numbers, we get:
original data: .Ln(Rate of Death) = .735 * (-.904) + .185 * 14.089 + .29 * 1.059 = 2.249 or Y = 9.5
The actual data point is Ln(Rate if Death) =2.14 or Y = 8.5, not too far from the estimation.
With a 10% increase in the ownership rate, we find that the Rate of Death = 10.18 people per 100,000 population.
Comparing this to our 9.7 from the previous calculation, we see that a 10% increase in gun ownership rate drives a 7.2% increase in additional deaths from all causes.
This seems the most reasonable to me intuitively as well as knowing the adjusted R2 is .97.
The Take Away
EXCEPT FOR THE STATISTICIANS among you, I imagine your brain is whirling (assuming you made it this far) and eyes are watering with all of that mathematical gobble-d-gook. But, I nevertheless present it all in case you want to check it out, or have it checked out.
The take-away from the scenarios and graphs presented above, each is consistent with the others and they all point to exactly the same thing, namely, "the more legal guns on the street, the more deaths there are from all causes." This relationship is extremely strong and cannot be denied. For those of you who want to try to refute it, please present similar analysis supporting your contention; there is plenty of data out there to use.
Now, I need to present one major caveat - while the analysis above is powerful, it nevertheless does not prove why this relationship exists, only that it does exist and can be relied on with a reasonable degree of certainty, based on the statistics surrounding the regression.
Further, the multiple regression, which has the best statistics, is not necessarily what I would finally end up with. The reason being is if I had been given this task back in the day when I did such work, it probably would have taken a month to complete, given the issues with the outliers mentioned above and the fundamental interactions between several important demographic variables.
What is Next?
WHAT I JUST PRESENTED IS ACTUALLY obvious to most people both intuitively and by observation. However, it does not answer the real questions regarding gun ownership in America; it only lays the foundation. The next layer is to peel-back-the-onion one layer and look at what most concerns gun advocates, violent crime.
We will look at this important aspect of the gun controversy next.
SO, WHAT DO YOU THINK
AM I CORRECT ABOUT THE STRONG RELATIONSHIP BETWEEN THE RATE OF GUN OWNERSHIP AND THE RATE OF GUN DEATHS FROM ALL CAUSES?
DEMOGRAPHIC SURVEY
ARE YOU
© 2013 Scott Belford
Related
Why Do We Own Guns?
Gun Rights: Part 2: Violent Crime: Will Reasonable Gun Control Save Lives?
Gun Rights: Not All Firearms Are Constitutionally Protected As Some Would Have You Believe. [278*3]
New Gun Laws Won't Reduce Gun Violence

Gun Control and the Right to Bear Arms: a Foreign Perspective on the Pro-Gun Lobby
![Gun Rights: Not All Firearms Are Constitutionally Protected As Some Would Have You Believe. [278*3]](https://usercontent2.hubstatic.com/12935107_f120.jpg)